When doing a bit of deep diving of the more recent Environmetal Impact assessment Report (EIAR) of the biogas plant – we found so many holes in that its not even fit for recycling! There are many questions but surely that’s the purpose of this EIAR – to answer the questions. There are too many ‘average’ scenarios, inconsistencies, invalid assumptions that make this EIA fit for the bin. Here are some examples of some of the analysis.
- Water Requirements – The biogas plant could require a water supply equivalent to over 5000 people, however – none was requested.
- Traffic Analysis could be 5 times more than what is predicted
- Flooding – This is unpredictable yet plant wants to go ahead just 10m from Gort River.
Water Requirements
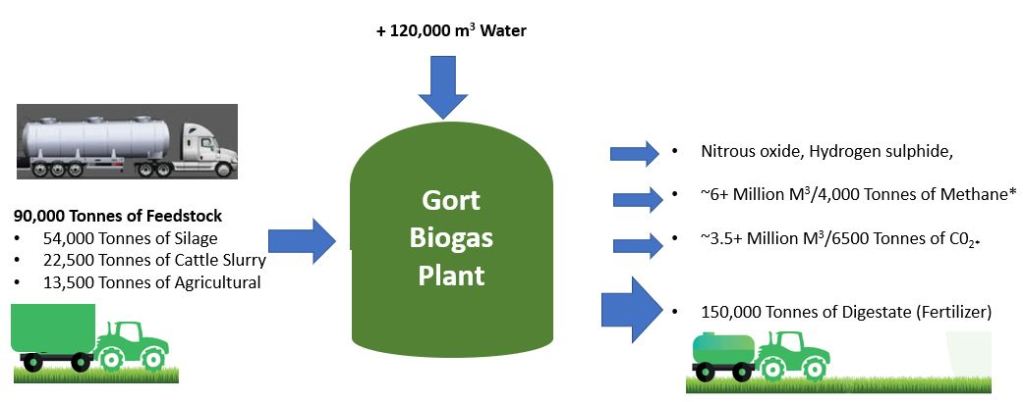
In water requirements in section 1.3 of Stormwater report 1.3 states “For anaerobic digestion to take place, the digestate must have a dry matter concentration of just 5%-8%, and therefore there will be a demand for up to 120,000m3 of liquor per annum at the plant. “
How was the number 120,000 m3/year calculated? If we only consider Silage as is the main feedstock, then
- 1 ton of silage (DM Dry matter content @ 28% [1,2] could require 4 tons (m3) of water to bring it to the right dilution (5%-8%)
- 54,000 tons of silage could in fact require up to 213,120M3 of water.
The final digestate would then be concentrated to a dry-matter content of 7-9%- (Page 2-42) so just looking at silage, then 54,000 tonnes of silage would still require over 200,000 M3/ Year – just for silage. Therefore the figure of 120,000 m3/year proposed seems to be incorrect.
Even if we use the EIAR conservative figure of 120,000m3/year, with Silage being a very high dry mater content, compared to pig slurry@8% and Cattle slurry at 10% [2]), the silage could still require 75% of the water resources for feedstocks – which is about 90,000 M3. Considering as main silage processing time would run from about mid-May for about a 4 month cutting period – this could average 90,000M3/ over 4 months, 22,000M3/Month.
Now the report says that rainfall will be used to supply this. However :
- An average rainfall (form Shannon) would just generate at total of 37,000 M3 in total (3.4ha with average rainfall of 977mm – as per rainfall in report in EIAR) .
- It gets worse though because that’s average and the water requirements will peak in the summer for instance in the summer 2018, right at the peak of the dry spell, June recorded just 62.5mm at Athenry station and the contributed rainfall volume that month was 967 M3/Month, which is <1% of what the monthly demand could be.
The report also says they will have connection to the Irish Water network for a grand connectivity of 0.042litres/per Second, which is 90M3/Month. Therefore rainfall and water supply would only supply 1057 M3/Month with the requirement of 22,000M3/Month, leaving a shortfall of 21,000 cubic metres of water/Month. To put this in real terms that the amount of water to supply a town of over 5,000 people [2], and that’s with the conservative EIAR numbers!
This is like having to add a town of size of 5,000 people onto your water network!
So what are the impacts of sustaining this increase in water requirements, in a town the size of Gort. What affects would this have on our SACs (Lough Cutra, Coole?) – especially thinking about the dry June-July 2018.
Inconsistencies
Other inconsistencies arond water include
- The Stormwater report, (JBA Consultants) include, sSection 1.2 indicates that the biogas plant will intake up to 150,000 tonnes per anum of feedstock. This number contradict the 90,000 tonnes mentioned in other sections of the EIAR.
- Section 7.3.6 of Rainfall and Evapottransipiration claims that the meteorological station located Shannon Airport is the nearest to Gort. In fact Athenry is and has a higher average rainfall that could impact stormwater calculations
Why are there so many poor assumptions, miscalculations and inconsistencies in what is supposed to be a full Environment Impact Assessment. What about the miscalculations that we haven’t spotted. Will the Gort Biogas plant become another Derrybrien where we learn too late – after the fact that the proper analysis wasn’t done.
On the grounds that the impact assessment around water and hydrology has a significantly poor quality, this application must be rejected.
[1] https://www.teagasc.ie/media/website/publications/2016/Teagasc-Quality-Grass-Silage-Guide.pdf
[2] http://www.biogas-info.co.uk/about/feedstocks/
[3] https://www.thejournal.ie/average-water-use-ireland-facts-3339951-May2017/
http://www.biogas-info.co.uk/about/feedstocks/
Traffic Analysis
In relation to traffic impact analysis – there are a number of concerns. This application states predicted average and maximum daily 2-way movements of HGVs but there are serious concerns about these numbers.
Digestate removal
The report says there will be an average of 11 HGVs/day collecting digestate and a maximum of 14 HGVs. Section 2.7 – Volume 2 indicates that the 150,000 M3 of digestate could be produced per year and implies that there would be a significant reduction in digestate transport during the closed-season between mid-October to mid-January (Section 2.7 – Volume 2) – It’s easy to come up the number 11
- 150,000 Tooes/Year = 410 tons a day (on average) and with a 40 ton lorry that’s 11 loads a day on average.
However this figure doesn’t take into account the closed season when the digestate will be stored. The EIAR states :
In terms of storage capacity, the volume of storage should be guided and sufficiently sized to cater for digestate production between the period mid-October to mid-January (approximately 20 weeks depending on location within the country and weather conditions).
That leaves approx. 32 window in which you are transporting digestate and works out at average at 670 Tons/Day requiring 17, not 11 HGVs on average – assuming these are all 40-ton trucks.
There are no estimations or evidence of average truck loads or types but if the average truck load/size was 30-ton then that makes 22 x HGVs per day on average which is a reasonable assumption and already twice the average and already well above the maximum stated in this Report.
There is no analysis of seasonal/peak digestate collection so where did the figure of a maximum of 14 HGVs/Day come from? I would assume that once growing season commences, from mid-January, and when the digesters are at maximum capacity, there would be a spike in demand to deliver digestate and maximise plant production. Due to feedstock supply demand there would be another peak after Silage cutting has commenced and again another major spike before closing season (to empty tanks). It is not unreasonable that these times could produce a 2-3x factor in demand compared to other times so digestate collection could in fact indicated require -40-60 HGVs per day.
Rather than the 11 HGVs/Day taking digestate from the site we could be looking at peak flows of 40-60 HGVs/Day.
Feedstock Delivery
This application also contains similar basic miscalculations and poor assumptions around feedstock delivery. The EIA report states
- he average for feedstock delivery would be 10 HGVs/Day and maximum would be 11/Day.
Silage cutting for maximum yield will start from Mid-End of May (when yield is maximum) and thus a 4 month timeframe would see the majority of the 56,000 tonnes of Silage being transported in this timeframe averaging 13,000 tones/a month or 450 tonnes a day which again is averaging 11 HGVs a day (Assuming 40 Tonnes average weight) but if we again assume a more reasonable average loads of 30 tons, we would get 14 HGVs.
This number is a daily average over 4 months and again, within that window, as you can see every summer the silage cutting demand, so again there may be peaks and troughs within this. This means that the maximum could be much more than this e.g. for a 2-3x the demand would give 40 HGV/Day delivering feedstock. Again, the report is deficient in its analysis of peak supply/demand scenarios
Adding up these potential volumes with potential with merging of some peaks around 1st cut silage and including CO2 and Methane could reasonably assume a maximum of 100 HGVs per day and the concentration of this could be during peak production times around the tourist season for South Galway.
This report is lacking in any real supply/demand analysis and therefore this impact assessment should be voided.
Routes
The EIAR indicated that “TRSA have been informed that hauliers making deliveries related to the proposed development will be contracted to enter the site from the south via the M18 motorway junction 16 to the north of Gort, and via the R458 regional road from the motorway junction to the site access. TTRSA have also been informed that no feedstock deliveries will be made using tractor hauled slurry type tankers and that no feedstock deliveries will be routed through Gort town centre.”
This statement explicitly mentions deliveriess but does not make references to hauliers collecting digestate on routes and more pointedly, only feedstocks are mentioned. As we know up to 90,000 tons could be delivered and 150,000 tonns would be collected. As the EIAR proposed “to provide digestate to farmers in the general area of the site” (section 2.7.1), this means that there could be a maximum of 70-80 trucks collecting material unconstrained to through Gort for delivery out Ennis Road, Tubber road, loughrea/Tynagh or over as far as , Galway road, etc. or include HGV routes through Ballylee to get to Loughrea road, Peterwell etc.
If no feedstock deliveries will be routed through Gort town centre then how would silage from north east Gort be transferred? This EIAR statement doesn’t actually indicate that hauliers have to use the motorway but just they have to enter the site via the roundabout at Junction 10 (then use the traffic island) . This means some trucks coming from the north via R458 (Ardrahan, Kiltartan, Labane) could have to use the roundabout as a U-Turn mechanism.
The EIAR proposestto use motorway but, can’t enforce it.
Bottleneck
According to the EIAR, as all deliveries will be mandated to come through the roundabout on the R458, why was there no traffic analysis done on this roundabout especially when that junction will receive potentially all of the 2-way traffic. With the numbers given previously there could be a maximum of 200 HGV’s passing through it per day averaging at 16 per hour. The report states that HGV trips will be distributed across the operational working day of the proposed development, but will typically occur during daylight hours. How is this realistic during peak times as indicated previously?
This roundabout is used by locals and tourists as walking, cycling and vehicular access to and from Coole Park and is the only entry point to Gort From the motorway so an accident here will prevent motorway exits for significant distances and further increase risk of accidents.
This report has ommited any analysis on the Roundabout where is is mandating traffic entering the site to use.
Inconsistencies
Table 9.10 of the Noise section mixes up PCUs and HGV movements. It uses average veichle movements rather than the maximum PCU movements. E.g. for feedstock deliveries Table 9.10 states a figure of 10. However 10 is the average number of HGV vehicles, whereas the maximum is 25 PCUS. That 2.5 times more than what has been indicated in Table 9.10. Therefore from just using the numbers in the report thetraffic analysis is defunct.
Conclusion
This EIAR concludes that ‘the proposed development is unlikely to result in capacity related issues on the local road network‘ but in summary a very poor and incomplete traffic analysis has been completed and the data presented in the EIAR, doesn’t reflect any real scenario. There is no delivery, collection analysis, no data presented on size, average loads of HGVs. There are no supply/demand simulations that could anticipate peak traffic flows.
The EIAR conclusions above must be rejected. Other EIAR conclusions related to traffic, such as noise levels, air quality levels must also be rendered null and void.
Flooding
Flooding is a key consideration in any large-scale development so close to rivers in South Galway

The proposed area shown within 2009 flooding
The Biogas Plant ,Flood Risk Assessment Technical Report analysis (EIRA Volume 3) references hydrology study WCFRAM UoM 29 – Galway Bay Hydraulic Modelling Report Vol 2b – Gort v4,. The report indicated that estimated probable flood levels extended across the development (see Figure 4-1) it can be confirmed that the site is located in Flood Zone C, at low risk of fluvial flooding. When discussing Flood Risk Mitigations JBA Consulting highlighted that “the concrete bund is the critical piece of infrastructure that will ensure the site is mitigated against the upwelling of high groundwater levels related to the fluvial flood levels on the Gort River. This has resulted in a bund top level of 19.1mOD and any buildings outside of the bund being raised to 19.2mOD. These levels offer protection against maximum estimated flood levels including the impacts of climate change. “
However, due to the Geology and corresponding hydrology of South Galway, flooding has always been extremely complex and difficult to predict. Maximum flood levels have been continuously broken several times in the past few decades (1990, 1995, 2009, 2015) as indicated in the’ South Galway – Gort Lowlands Flood Relief Scheme Project Brief. The project brief states :
The combination of river water, groundwater, swallow holes and turloughs in the karst Gort Lowlands catchment, makes this area unique on an international level from an ecology perspective and this is evidenced by the number of Designated Areas (SACs, SPAs and pNHAs) attributed to the catchment, see Appendix M(2). The complexity of the flow network within the catchment has justified an ongoing collaborative study between Geological Survey Ireland and University of Dublin Trinity College which will greatly assist in the formation of the hydrological and hydraulic analysis of the scheme
Section E.2 (Page 130) of the 2018 Flood Risk Management Plan for River Basin 29 (including Gort) has a section on Flood Risk Analysis in Gort. It includes predicted flooding on the Kinincha Road and states “The Kinincha Road also flooded in 2009 and is modelled as flooding slightly in the 10% design event and much more extensively in larger design events.” However this needs to be taken into context with section following it (Section E.3 – Model Uncertainty) and indicates that there are number of limitations including the influence of groundwater, Lack of calibration data and the affects the upstream works in Gort Bridge would have and “this makes calibration of the model less certain. The modelling of influence on groundwater (e.g. Turloughs) was beyond the scope of the Western CFRAM study.
With so many downstream SAC’s associated with the Catchment, how should this uncertainty be treated when planning a large-scale development so close to the river?
The Appropriate Assessment Guidelines 2009, from NPWS, states that the Natura Impact Assessment applies the precautionary principle and the focus of the statement should be on demonstrating objectively, with supporting evidence, that there will be no adverse effects on the integrity of the Natura 2000 site. Where this cannot be demonstrated, adverse effects must be assumed and the Statement must reflect that.
Given the stated hydrology model uncertainty in the 2018 Flood Risk Management Plan, the extensive ongoing work to get to an acceptable level of hydrology-model certainty with the South Galway – Gort Lowlands Flood Relief Scheme, and the lack of any current flood relief solution, it is clear that, with precautionary principle, adverse affects must be assumed, however the EIAR/Natura Impact Statement does not reflect this and is therefore the planning application is not compliant to Article 6 of the Habitats Directive and therefore must be refused.